
Runs and outputs
A run is one execution of a Flow. It shows what the browser did, which Blocks succeeded or failed, and what output the Flow produced.
Run modes
Scrapeer supports local runs and Cloud Runs.
Use a local run while you are building and debugging a Flow. You can watch the browser state, adjust Blocks, and rerun quickly. Use a Cloud Run when the workflow should run away from your machine or when you want hosted execution. Cloud Runs use credits.
Do not assume a Flow is production-ready because it ran once. Run it again after changing selectors, waits, variables, loops, exports, or target pages.
Outputs
Output is the data or file a Flow creates during a run. Depending on the Blocks in the Flow, output can be text, rows, transformed values, files, logs, or data sent to another tool.
Inspect output before scheduling or repeating a workflow. Empty rows, missing fields, wrong values, or unexpected file names usually mean an earlier Block needs attention.
Failed runs
A failed run is not just a red status. It is a pointer to the part of the workflow that needs work. Start with the earliest Block that failed or produced unexpected output.
Common causes are simple and visible:
- The page did not load the expected state.
- The Flow clicked or read the wrong element.
- The page layout changed.
- A login, permission, CAPTCHA, or access limit blocked the browser.
- A variable was empty or misspelled.
- An export Block did not receive the data it expected.
How to debug a run
Scrapeer has two canvas modes: Editor and Inspector. Use Editor when you are changing the Flow. Use Inspector when you want to review what happened in a past run.
Open Inspector from the Executions list by selecting a past run. You can also click Inspector in the mode switcher at the top of the canvas. If no run is selected yet, Scrapeer opens the most recent completed run when one is available.
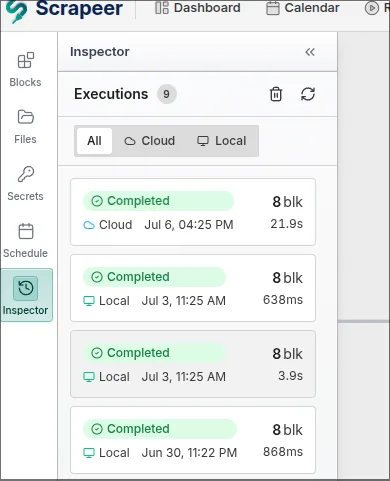
In Inspector mode, the canvas shows a historical snapshot of that run. Start with the left sidebar: check whether the run was local or cloud, when it started, how long it took, and which Blocks produced results. Then follow the Flow from left to right and look for the earliest Block with an error, empty output, or unexpected data.
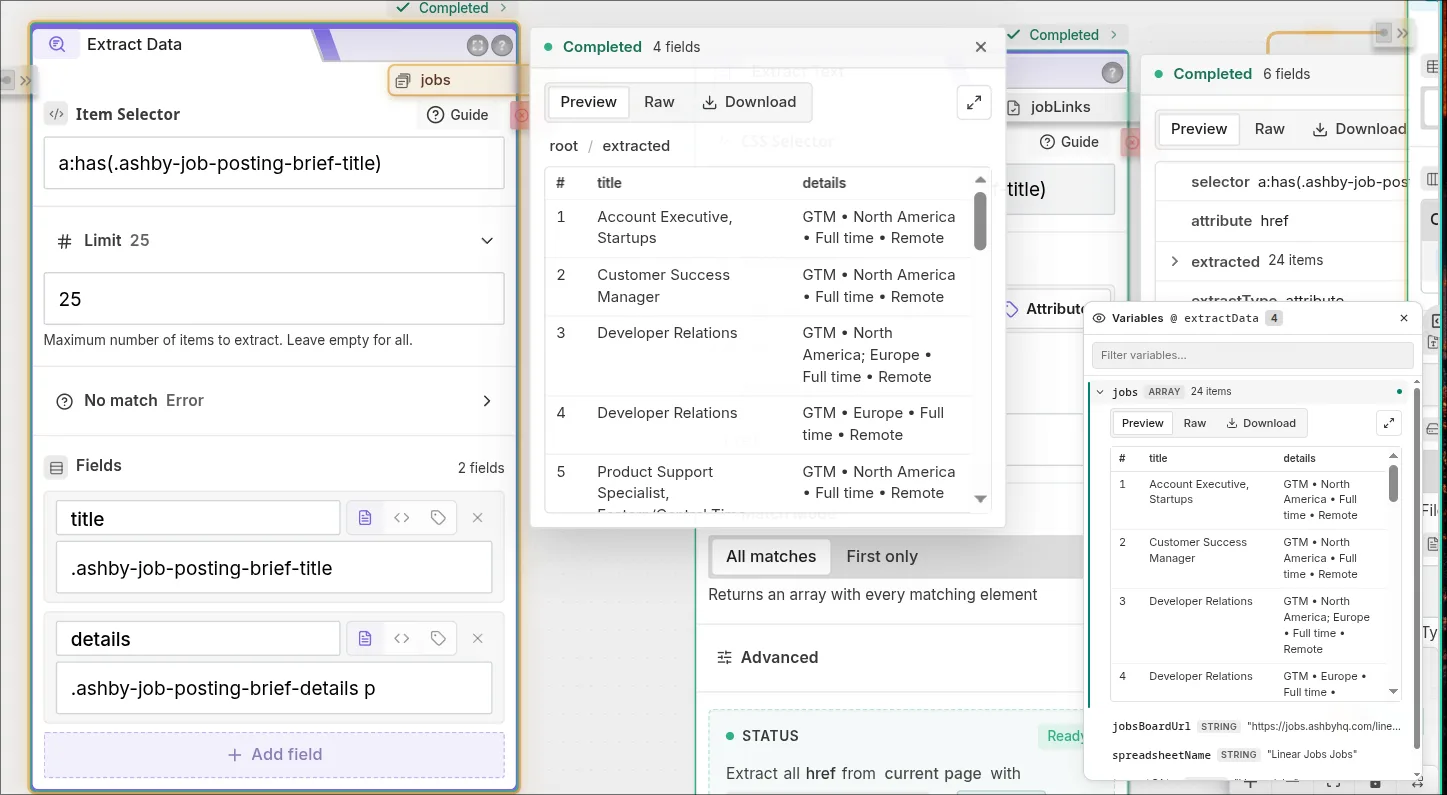
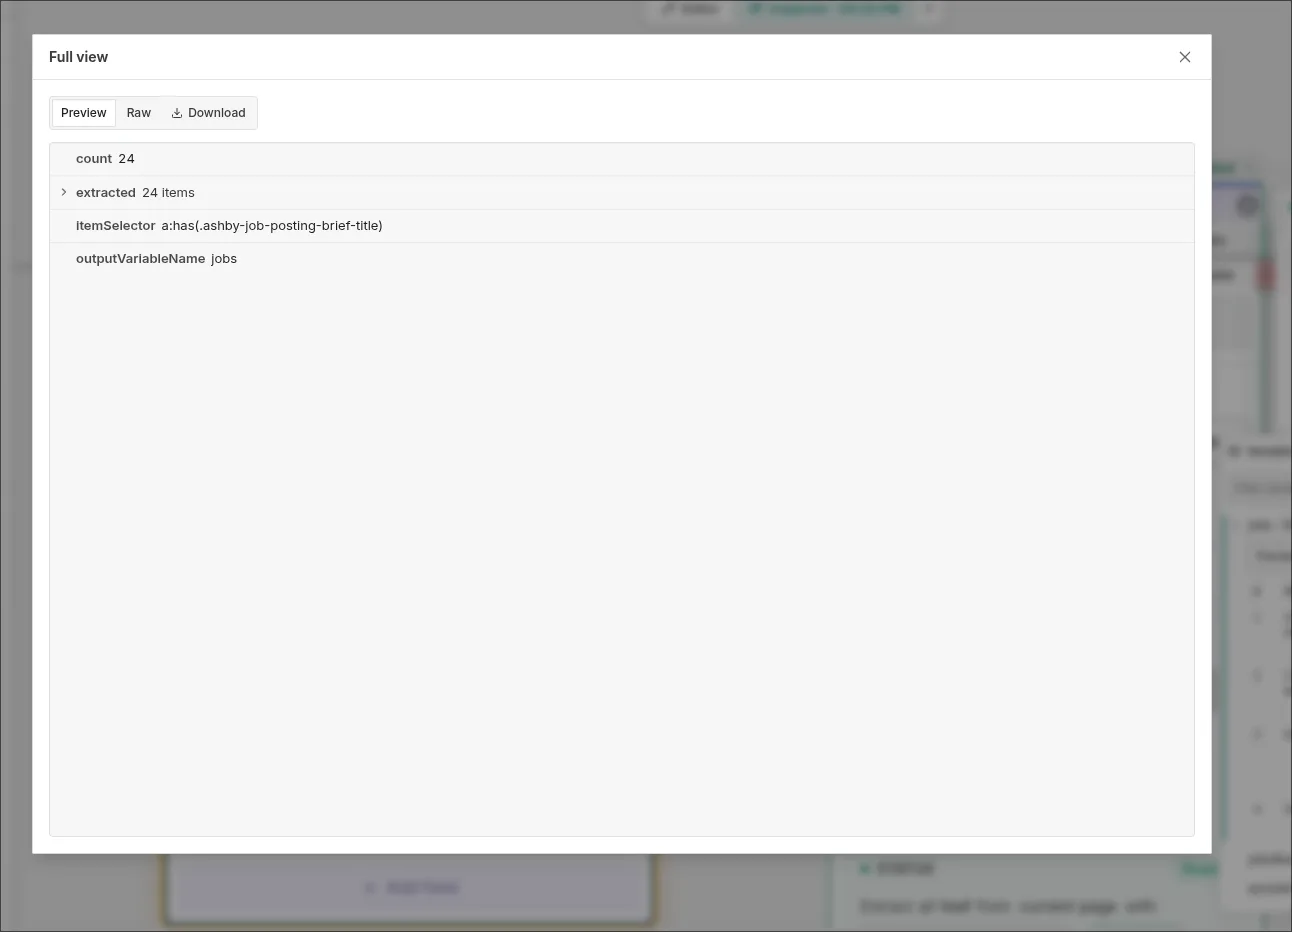
Completed Blocks can show result previews next to the Block. Use Preview for readable tables and objects, Raw when you need the exact JSON value, and Download when the result should be saved locally. For larger previews, open the full view and inspect the data in a larger panel.
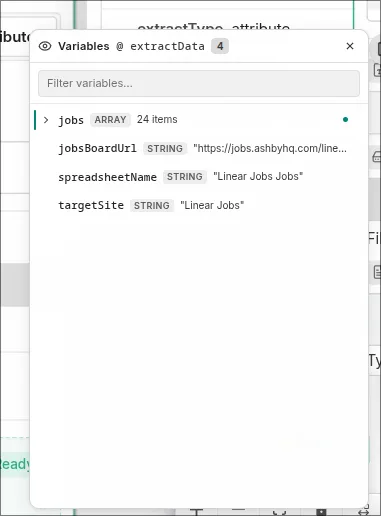
Use the Variables panel in the bottom-right of Inspector mode to see variable values at the selected Block. Select another Block to compare how values changed as the run moved through the Flow. Filter the list when there are many variables. Hovering a variable row or a variable pill on the canvas highlights where that value is produced and where it is used, which makes it easier to understand the path through the Flow.
Fix one thing at a time. After changing a selector, wait, variable name, or export setting, run the Flow again and inspect the new result before adding more complexity.